MLB Historical Betting Systems Research

Tom Herbert

Tom Herbert

Last Updated: May 27, 2026

MLB Betting Systems (2004–Present Data Archive)

This archive contains historically tested MLB betting systems from 2004–present, including underdog value systems, travel fatigue angles, divisional familiarity trends, early-season market inefficiencies, and public betting bias exploits.

Unlike recreational betting content, this is a structured research archive — not daily picks.

Each system published here is derived from long-term historical data, tested across full MLB seasons, and built around repeatable market behaviors rather than short-term variance.

The objective is not prediction.
The objective is to identify structural pricing inefficiencies within the MLB betting market.

What Qualifies As An MLB Betting System?

Every system included in this archive meets strict criteria:

  • Clearly defined situational rules
  • Historical sample size disclosure
  • Straight-up and/or ROI performance
  • Logical market explanation
  • Multi-season validation

If a system does not demonstrate structural consistency across time, it is not included.
This is not trend mining.
This is market behavior research.

Why MLB Is Ideal For System-Based Betting

MLB is structurally unique among professional sports markets.

Large Sample Size

With 2,430 regular season games per year, MLB provides enough data volume to evaluate long-term pricing patterns without relying on small samples.

Moneyline Pricing Dynamics

Baseball’s heavy moneyline structure creates natural public bias toward favorites and high-profile teams. Underdog pricing inefficiencies appear repeatedly in historical data.

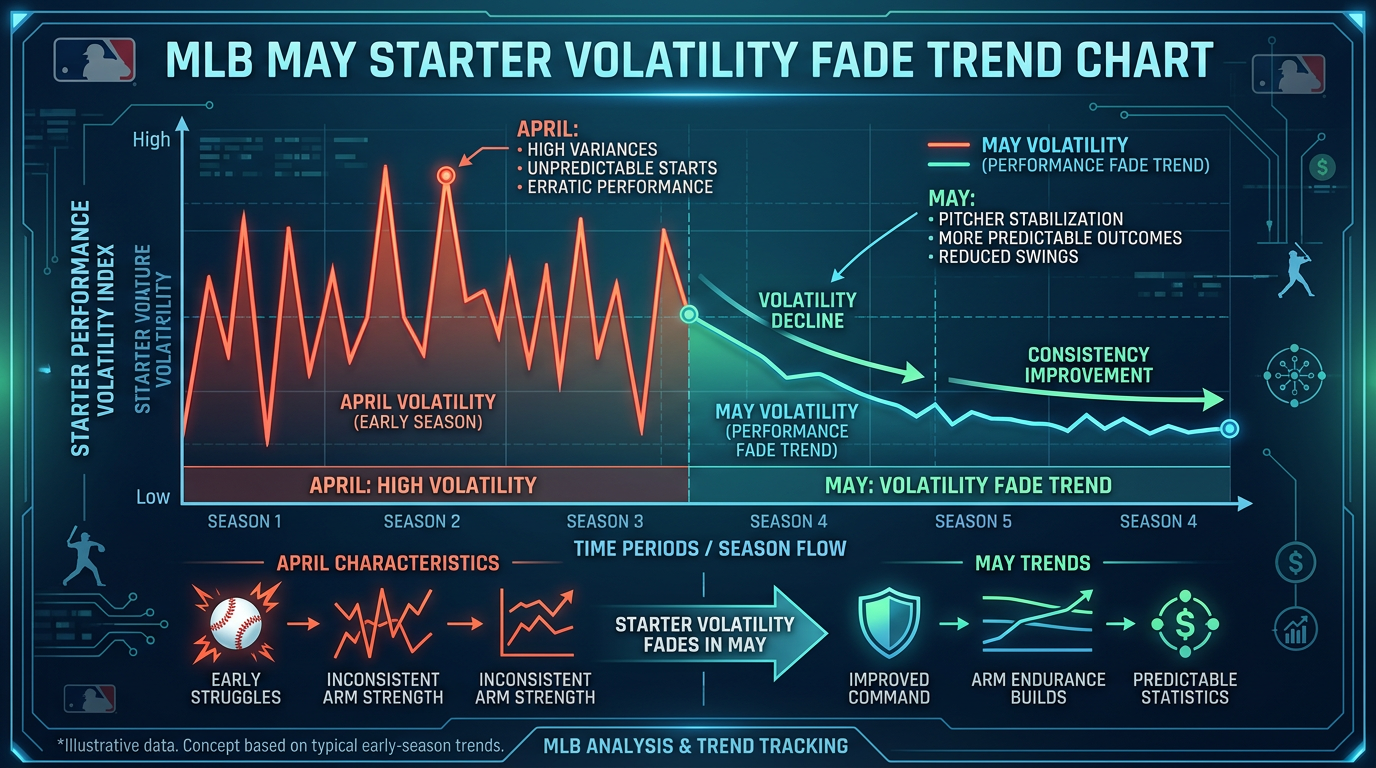
Early-Season Volatility

April and May markets frequently overweight small sample results. Standings perception often diverges from underlying team strength.

Travel & Scheduling Effects

Long road trips, divisional familiarity, getaway games, and bullpen fatigue create structural pressure points that markets do not always price efficiently.

MLB is not perfect — but it consistently produces measurable behavioral edges.

Categories Of MLB Systems In This Archive

Systems published here typically fall into one of the following structural groups:

  • Early-season volatility systems
  • Divisional familiarity systems
  • Underdog value systems
  • Travel and fatigue systems
  • Bullpen regression situations
  • Public bias fade systems

Each individual article contains:

  • Exact qualification rules
  • Historical win/loss results
  • ROI breakdown
  • Why the edge exists
  • Where the edge fails

Why Most Betting Systems Fail

Most betting systems published online fail for predictable reasons:

  • Small sample sizes
  • Data-mined overfitting
  • Ignoring closing line value
  • Recency bias
  • Survivorship bias
  • No structural explanation for why the edge exists

Short-term performance does not equal structural edge.
This archive prioritizes repeatability over excitement.

Methodology & Data Integrity

All systems are derived from a structured MLB database built from:

  • Historical game logs (2004–present)
  • Closing line data
  • Situational scheduling inputs
  • Team and bullpen performance context

Systems are not cherry-picked from isolated seasons.
They are evaluated across multiple seasons and market conditions.
For a deeper explanation of betting market behavior and pricing mechanics, see the Sports Betting Market Mechanics educational hub.

Relationship To Raw Numbers

The systems published here represent distilled, rule-based expressions of broader data research.

Subscribers with access to Raw Numbers MLB gain direct access to expanded structural filters and customizable data exploration beyond the public systems shown here.

Raw Numbers is the research engine.
These systems are the applied outputs.

How To Use This Archive

This archive is designed as a research library.
Individual systems may:

  • Stand alone
  • Be layered with other systems
  • Inform broader modeling frameworks
  • Highlight market bias patterns

They are not daily picks.
They are structural frameworks.

Access Expanded MLB Structural Data

If you want to explore MLB betting systems beyond published rule sets — including deeper structural filters, situational splits, and historical market behavior — explore:

→ Raw Numbers MLB

Full database access provides deeper structural filtering and analytical control beyond standalone systems.


Recently Published MLB Betting Systems

If you’re new, start with:
• Early-Season MLB Underdogs Below .500
• Why MLB Home Teams Become Profitable After April

  • MLB SDQL Under systems graphic showing baseball analytics, early starts, prior Unders, and series suppression trends.

    MLB SDQL Under Betting Systems: Early Starts, Prior Unders, and Series Suppression

    This content outlines three MLB SDQL Under betting systems, which focus on identifying conditions that suppress run scoring, such as early game starts, strong recent pitching, and low earned runs. Each system highlights historical trends where totals were inaccurately high, aiming to provide profitable betting opportunities for the Under market.

  • MLB SDQL Under betting systems graphic showing baseball analytics, low offense trends, road dogs, and suppressed totals.

    MLB SDQL Under Betting Systems: Low Offense, Road Dogs, and Suppressed Total Environments

    These MLB SDQL Under betting systems focus on identifying games where recent offense suggests lower scoring, highlighting specific trends that indicate market totals might be too high. The three systems analyze factors like low hits, bullpen performance, and past game outcomes, demonstrating the potential for profitable betting on Under outcomes under certain conditions.

  • MLB SDQL betting trends graphic showing baseball analytics, betting charts, overs, road dogs, and low-total unders.

    MLB SDQL Betting Trends: Overs, Short Road Dogs, and Low-Total Under Pressure

    MLB betting markets frequently respond to clear signals like starting pitchers and offensive performance. The SDQL trends discussed highlight potential betting opportunities by measuring team performance under specific conditions. Key trends include low-total Overs after poor pitching performances, betting on short road dogs against strong teams, and identifiers for scoring patterns, emphasizing market mispricing.

  • MLB low-win Under trend showing SDQL betting data, Under record, ROI, and starter workload filters

    MLB Low-Win Under Trend: Since 2024 SDQL System Analysis

    The MLB low-win Under trend identifies a repeated pattern for teams with low winning percentages, prior game tension, and limited pitcher workloads. Since 2024, it has recorded 135 wins to 80 losses, achieving a 62.8% win rate and 19.3% ROI. The trend highlights specific conditions where totals may be overstated.

  • MLB May run line trend starter volatility fade system

    MLB May Run Line Trend: Fading a Narrow Starter Volatility Setup

    The MLB May run line trend indicates a significant historical fade signal against teams that experience starter volatility after prior high-pressure outings. With a poor record of 2-19 straight up and 3-18 on the run line, it highlights how market perceptions may misprice underlying weaknesses. This trend should be used cautiously alongside broader analysis.

  • MLB Over Trends: Left on Base Edge

    MLB Over Trends: Left on Base Edge

    MLB betting trends reveal that when game totals exceed 9.5 and teams leave multiple baserunners, it signals undervalued offensives. This consistent inefficiency often leads to scoring corrections. High totals create market resistance, distorting expectations based on recent low-scoring games, allowing knowledgeable bettors to exploit mispriced opportunities for long-term value.

  • MLB Under SDQL Trend: Market Overreaction After Offensive Collapse

    MLB Under SDQL Trend: Market Overreaction After Offensive Collapse

    The MLB betting market overreacts to teams underperforming offensively, leading to potentially overpriced ‘Under’ totals. Despite a 46.2% win rate for a specific system, it’s unprofitable when betting blindly on the Under. Effective betting should involve identifying conditions and exploiting market inefficiencies rather than relying on established trends alone.

  • Fade April Low-Hit Teams MLB Run Line Betting Trend

    Fade April Low-Hit Teams MLB Run Line Betting Trend

    Early-season MLB run line results often mislead bettors because small-sample performance gets priced too aggressively into the market. What looks like dominance is frequently just variance being treated as signal. This MLB run line trend isolates a specific scenario where pitchers appear sharp on the surface—but that perception creates consistent overpricing on the run line. What…

  • MLB Underdog Betting System

    MLB Underdog Betting System

    This MLB underdog betting system reveals that consistently betting on undervalued road underdogs, particularly those coming off a loss against strong opponents, can yield profitability. Despite a 44.8% win rate, disciplined betting on these scenarios captures market inefficiencies, leading to a notable positive ROI and substantial profits.

  • Bounce Back MLB Betting System: Teams That Hit 4+ HRs and Still Lose

    Bounce Back MLB Betting System: Teams That Hit 4+ HRs and Still Lose

    When a team delivers elite offensive output but still loses, the market often reacts to the result rather than the performance. This system targets that exact disconnect — where strong underlying production is temporarily overshadowed by a negative outcome. Bounce Back MLB Betting System Summary Some of the most consistent betting edges come from situations where…

  • MLB Opening Day 2026: Data-Driven System Signals for March 27

    MLB Opening Day Systems Report:

    The report analyzes two data-driven systems for MLB Opening Day, revealing consistent historical patterns for betting performance since 2004.

  • How Often Do MLB Favorites Win?

    How Often Do MLB Favorites Win?

    Despite winning 58.2% of MLB games, betting on favorites results in negative long-term returns due to aggressive sportsbook pricing.

  • Are MLB Underdogs Profitable?

    Are MLB Underdogs Profitable?

    Many sports bettors are attracted to underdogs because they offer plus-money payouts. The idea is that occasional big wins can offset the lower win percentage. But does this strategy actually work in the long run? To answer this question, we analyzed all MLB underdogs since 2004. MLB Underdog Historical Results SU: 20,882–29,390Win Rate: 41.5%ROI: -3.2%Profit/Loss: -$160,917…

  • MLB Teams After Being Shut Out

    MLB Teams After Being Shut Out

    Teams shut out in a game seldom rebound successfully, leading to unprofitable betting outcomes despite common assumptions about motivation.

  • MLB Teams After Blowout Loss Betting Results Since 2004

    MLB Teams After Blowout Loss Betting Results Since 2004

    One of the most common narratives in sports betting is the idea that teams are likely to bounce back after a bad loss. When a team loses by a large margin, many bettors assume they will respond with a stronger performance in the next game. In Major League Baseball, this concept often appears after blowout losses,…

  • MLB Runline Betting Trends Since 2004

    MLB Runline Betting Trends Since 2004

    MLB Run Line betting shows underdogs cover more often than favorites; however, market adjustments make consistent profits challenging.

  • MLB Situational Betting Trends Since 2004

    MLB Situational Betting Trends Since 2004

    Baseball betting heavily relies on game situations, but sportsbooks efficiently price most factors, limiting profitable betting opportunities.

  • MLB Trends

    MLB Trends

    Various betting systems and trends reveal profitable strategies for MLB games based on team performance, odds, and specific conditions.

  • MLB Team Trends

    MLB Team Trends

    Exploring the Latest MLB Team Trends Analyzing Major League Baseball (MLB) team trends provides vital insights into performances, player statistics, and overall league dynamics. As we delve into this season’s trends, observe the emerging patterns that could influence future games and player strategies. Comprehensive Team Trends Here’s a detailed breakdown of notable MLB team trends, including…

  • MLB manager trends research board showing SDQL betting data, ROI, records, and statistical performance filters

    MLB Manager Trends

    The text outlines various Major League Baseball manager trends that indicate performance metrics under specific coaches. Notable examples are the New York Mets’ success as road underdogs under Terry Collins and the Oakland Athletics’ strong results as home favorites under Bob Melvin. The piece emphasizes evaluating trends alongside broader betting strategies for better insights.

  • MLB player trends analysis showing pitcher data, market pricing, ROI, and historical betting signals.

    MLB Player Trends

    MLB player trends offer insights into historical betting patterns, especially regarding pitchers. However, these trends should be analyzed alongside market price, sample size, and contextual factors. Ultimately, identifying genuine value rather than blindly following trends is essential for successful betting in MLB, highlighting the importance of market dynamics.

  • mlb weekend attendance trends

    Weekend Attendance in MLB Sports Betting

    Up until about the end of July, you see Saturday and Sunday average per day attendance (since 2004) reach its highest level. It reflects the heightened interest and excitement surrounding the summer events and the growing popularity of mlb sports betting. This annual surge in numbers often leads to a festive atmosphere, with fans eagerly gathering…